
Customer Analytics Platform: Make Every Customer Insight Count
Stop guessing your next business move. Real-time analytics, automated financial reporting and clear operational data organized around the three questions that actually change what you do tomorrow.
- Live Sales Tracking.
- Labor & Food Variance.
- Multi-Location Rollups.
- Automated Margins.
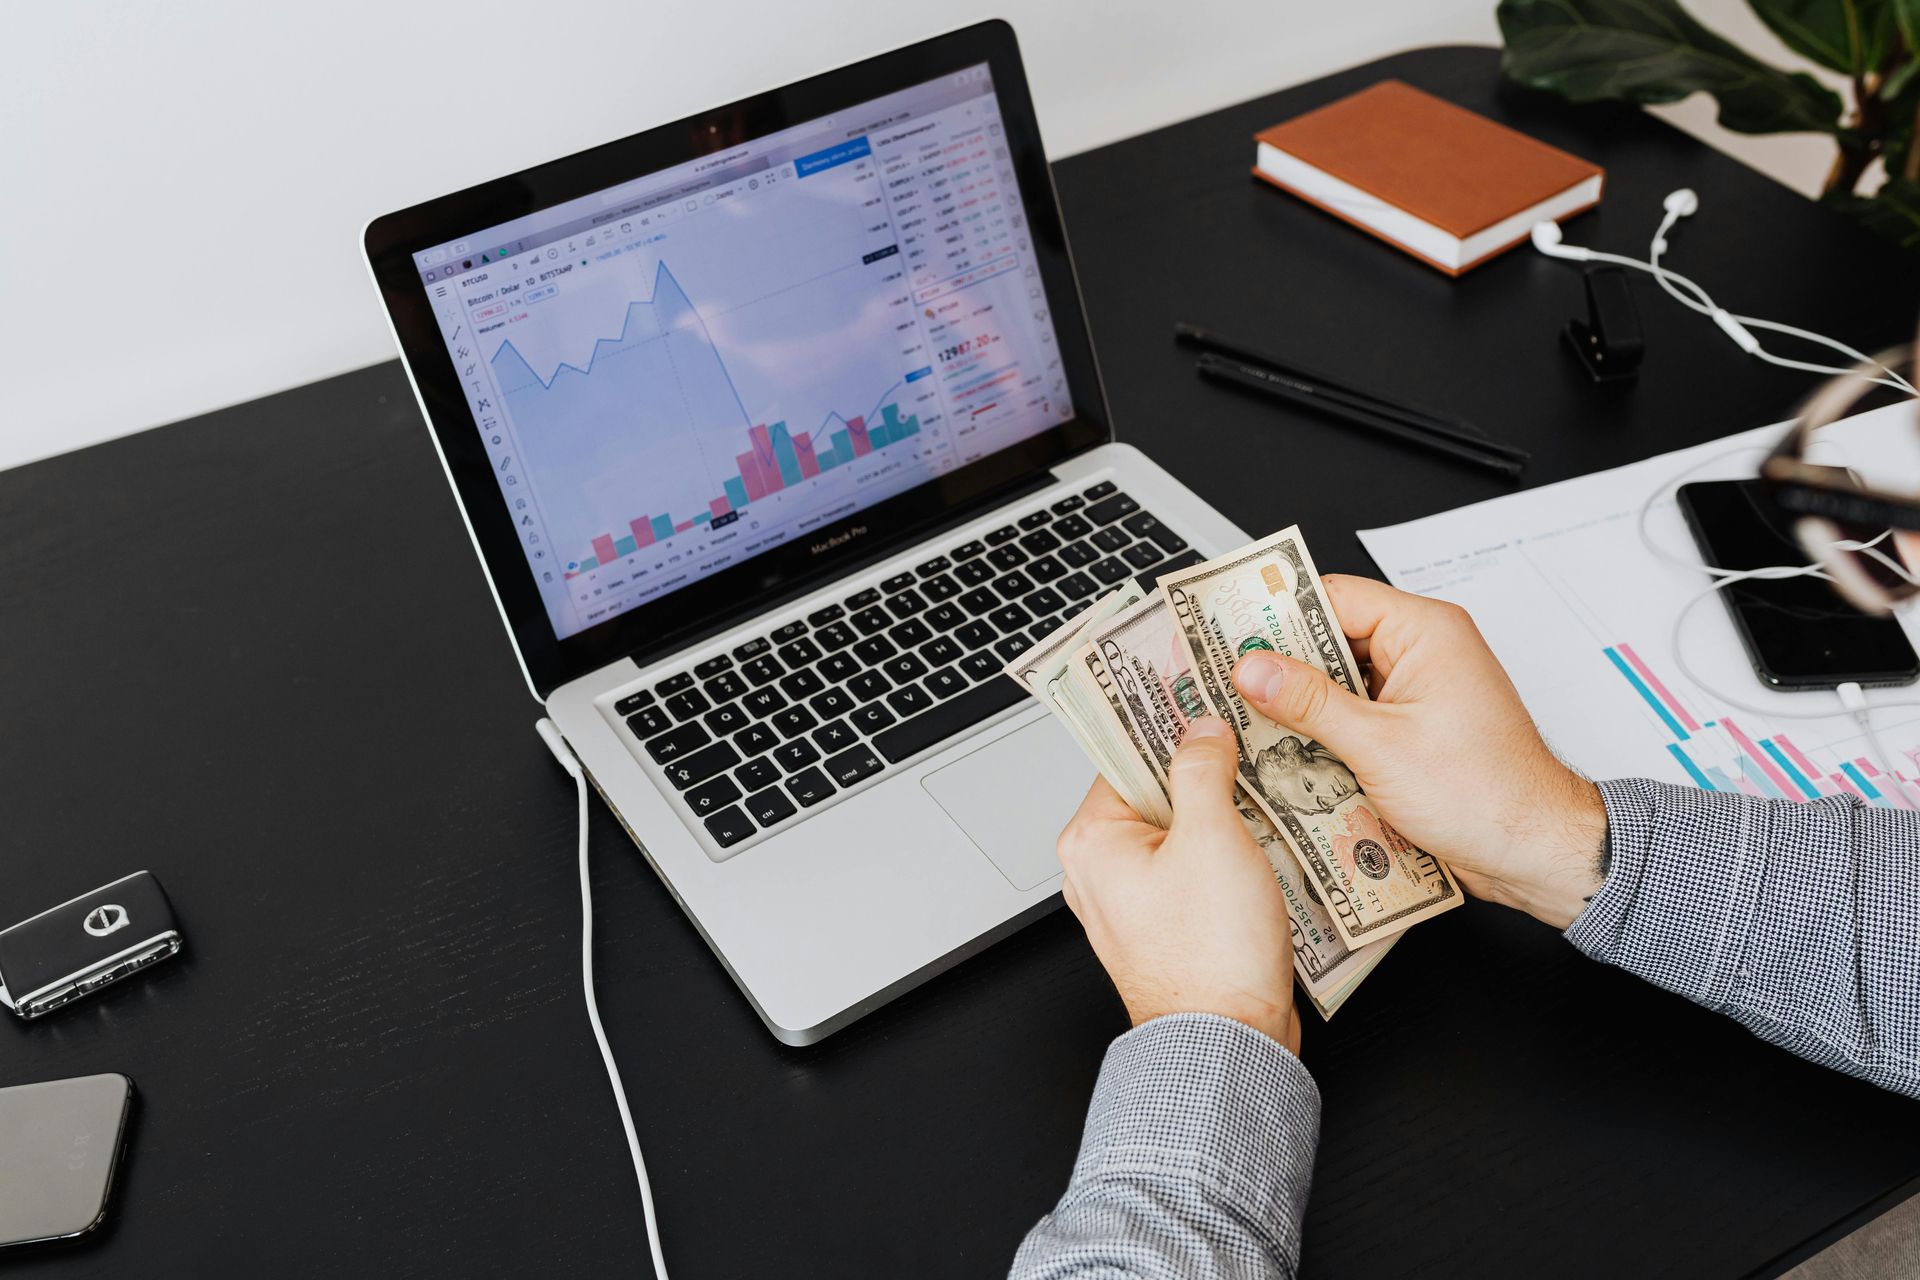
Every channel, cost, and shift feeds into a continuously updating dataset, so the joins happen once in the pipeline instead of weekly by hand. Live tracking moves the decision point forward by about four weeks, and variance detection flags cost gaps as they appear. Best of all, the reporting answers three questions rather than listing metrics: who buys, why, and what they buy next, each with an action attached.
What Analytics Management Sets Out to Fix?
Your data lives in systems that never meet, so someone joins CSV exports from POS, delivery apps and vendor invoices by hand, and the result is stale on arrival. You learn about a problem four weeks after the behaviour that caused it, while small cost gaps compound unnoticed. Even accurate figures arrive as dense rows: sales are down eight per cent, but nothing says why. Every channel, cost, and shift feeds into a continuously updating dataset, so the joins happen once in the pipeline instead of weekly by hand. Live tracking moves the decision point forward by about four weeks, and variance detection flags cost gaps as they appear. Best of all, the reporting answers three questions rather than listing metrics: who buys, why, and what they buy next, each with an action attached.
See your own numbers answer these questions
Bring one month of transactions to a demo and we will show you the segments already hiding in it.
Every Report Should Answer One of Three Things
1. WHO – Who is actually buying?
Customers group themselves by behaviour long before you name the groups. The analytics engine finds those groups in transaction history and gives each one a profile you can act on.
Behavioural segments built from purchase history, visit frequency and channel — not demographic guesswork.
Value ranking so you can see which segments carry the revenue and which only carry the volume.
Channel split showing who orders in store, on your site, and through marketplaces.
Location comparison revealing which segments are strong at one storefront and absent at another.


2. WHY - Why they buy when they do
Every transaction sits inside a set of conditions. Comparing purchases against those conditions surfaces the factors that consistently move a segment.
Ranked purchase drivers time of day, weather, staffing, promotions, price changes and channel, weighted by influence.
Product mix analytics ranking item popularity alongside exact ingredient gross margin.
Labor overlays mapping hourly sales against active shift rosters to show where service speed changes buying.
Variance detection exposing the gap between the ideal cost and what the register actually rang.
3. WHAT NEXT - What they buy next
Once a segment has a pattern, the next purchase becomes predictable within a range, and a prediction with a confidence score is something you can plan a shift around.
Next-purchase prediction with a confidence score, so you know how much weight to put on it.
Return-window estimates showing when each segment is due back and when it has gone quiet.
Predictive sales forecasting using historical trends and weather data to anticipate volume spikes and drops.
Recommended action attached to every prediction — the offer, the price, or the staffing change it implies.

From Scattered Exports to a Decision, in Four Steps
Connect the sources
POS registers, online ordering, delivery marketplaces, vendor invoices and labour schedules feed into one dataset.
01
02
Clean and unify
Duplicate customers are merged, items map to a catalogue & every transaction has a true cost.
03
Find the patterns
Segments form from behaviour, drivers are ranked by influence, and next-purchase predictions are scored.
04
Act on the answer
Dashboards, alerts and end-of-day reports arrive with a recommended action, not just a chart.
Find out what your data already knows
A demo walks through one segment end-to-end: who they are, what drives them & what they order next.
Deep-Dive Features of Reporting Tools Made Effortless
Predictive sales forecasting
Algorithms analyze historical transaction trends and weather data to predict customer volume spikes and drops.
01
02
Product mix analytics (P-Mix) (why)
Automated menu profiling that ranks item popularity directly alongside exact ingredient gross margin metrics.
03
Labor schedule overlays (why)
Visual charts map real-time hourly sales data directly against employees shift through single screen.
Customer segment profiles (who)
Every buyer group gets a profile card, visit frequency, average check, preferred channel & items.
04
05
Automated end-of-day reports (operations)
Secure, digital register and safe reconciliation tallies compiled and emailed automatically when the doors close.
06
Live sales tracking (operations)
Track revenue through POS, web and marketplace in real time, with variance flagged from start.
Simplify decisions for your business
Unified performance dashboards
Get complete visibility with visual, high-level summaries that let you spot and correct shift issues in seconds.
01
02
Live profit margin safeguards
Protect your bottom line by catching supplier price hikes before they quietly erase your menu or retail profitability.
03
Multi-unit comparison matrix
See exactly which regional storefronts are leading in check sizes, speed, or volume so you can replicate their strategy.
04
Secure cloud-based ledgers
Access essential cash flow numbers securely from any device, keeping bookkeeping organized and completely audit-ready.
Stop reporting on a month you can no longer change
See how live tracking and margin safeguards move the decision forward by four weeks.
Frequently Asked Questions(FAQs)
What is customer analytics software?
Customer analytics software turns transaction data into an understanding of the people behind the sales. It groups buyers into segments based on what they actually purchased, identifies which factors drive those purchases, and estimates what each group is likely to buy next — so decisions rest on observed behaviour rather than intuition.
How can you tell why someone bought something?
By comparing every transaction against the conditions surrounding it: time of day, weather, staffing levels, active promotions, price changes and channel. When a factor consistently coincides with a lift in a segment's purchases, it is ranked as a driver. These are correlations rather than proof of cause, which is why the strongest drivers are worth testing before you build a strategy on them.
How accurate are next-purchase predictions?
Every prediction carries a confidence score, and typical scores for established segments fall between 60 and 80 percent. Accuracy improves with transaction volume and history length. New segments and newly opened locations start lower until enough behaviour has accumulated.
Do I need a data analyst to use it?
No. Segments, drivers and predictions are generated automatically and presented as plain statements with a recommended action attached. Raw data remains exportable for teams that want to run their own analysis.
Which systems does it pull data from?
POS registers, online ordering, third-party delivery marketplaces, vendor invoices and labour schedules feed into a single dataset. mKonnekt Sales, Inventory, Pricing and Marketing share that dataset, so a change in one is visible in the others.
How long before the data is useful?
Live sales tracking and end-of-day reporting begin as soon as channels are connected. Segment profiles and driver analysis need roughly four to six weeks of history to stabilise, and next-purchase predictions become reliable once a segment shows repeat behaviour.
Connected Tools for Smarter Management

Reach the list you already own. Grow your active customer database automatically. Use real-time transaction histories to segment your audience and deploy targeted email and SMS blast campaigns that keep your storefront top-of-mind.

Move prices when costs move. Keep your customer pricing dynamically aligned with your back-end supply changes. Protect your gross margins by setting intelligent rules that automatically tweak retail prices when vendor ingredient invoices rise.
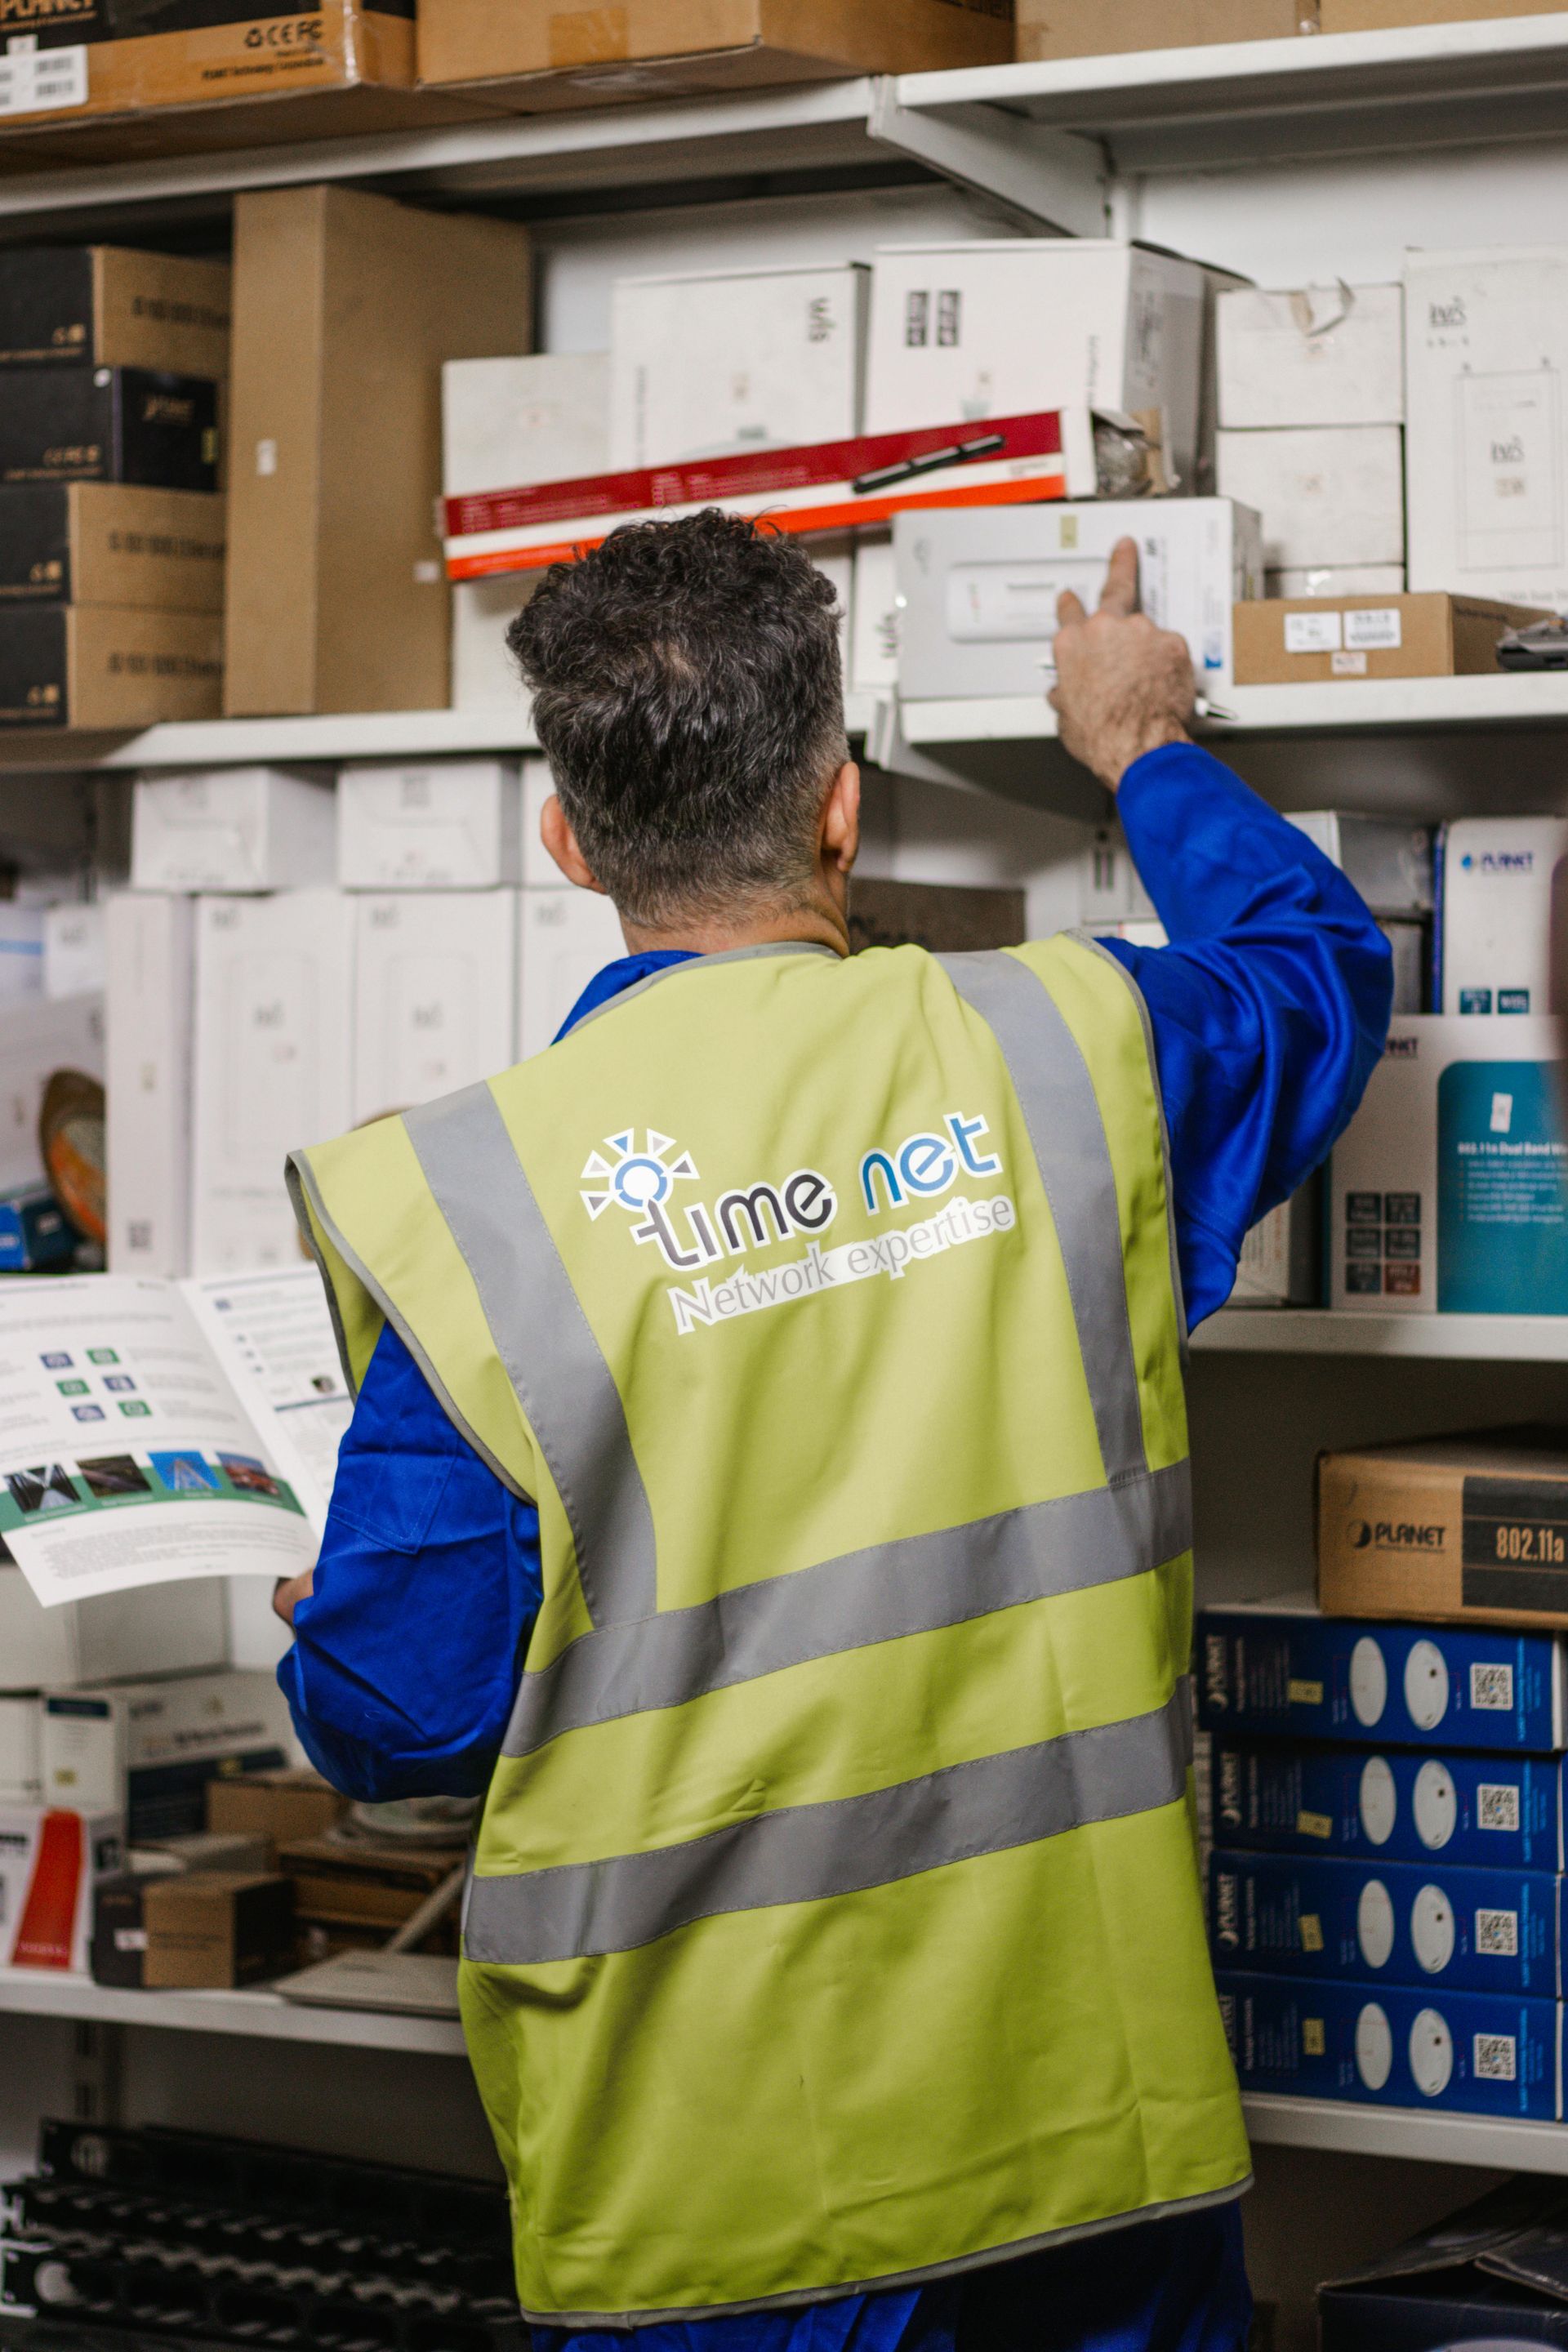
Take complete control of your stockroom. Monitor real-time ingredient and product counts dynamically as sales occur, manage multi-location transfers, and automatically track product variance to eliminate waste and protect your margins.
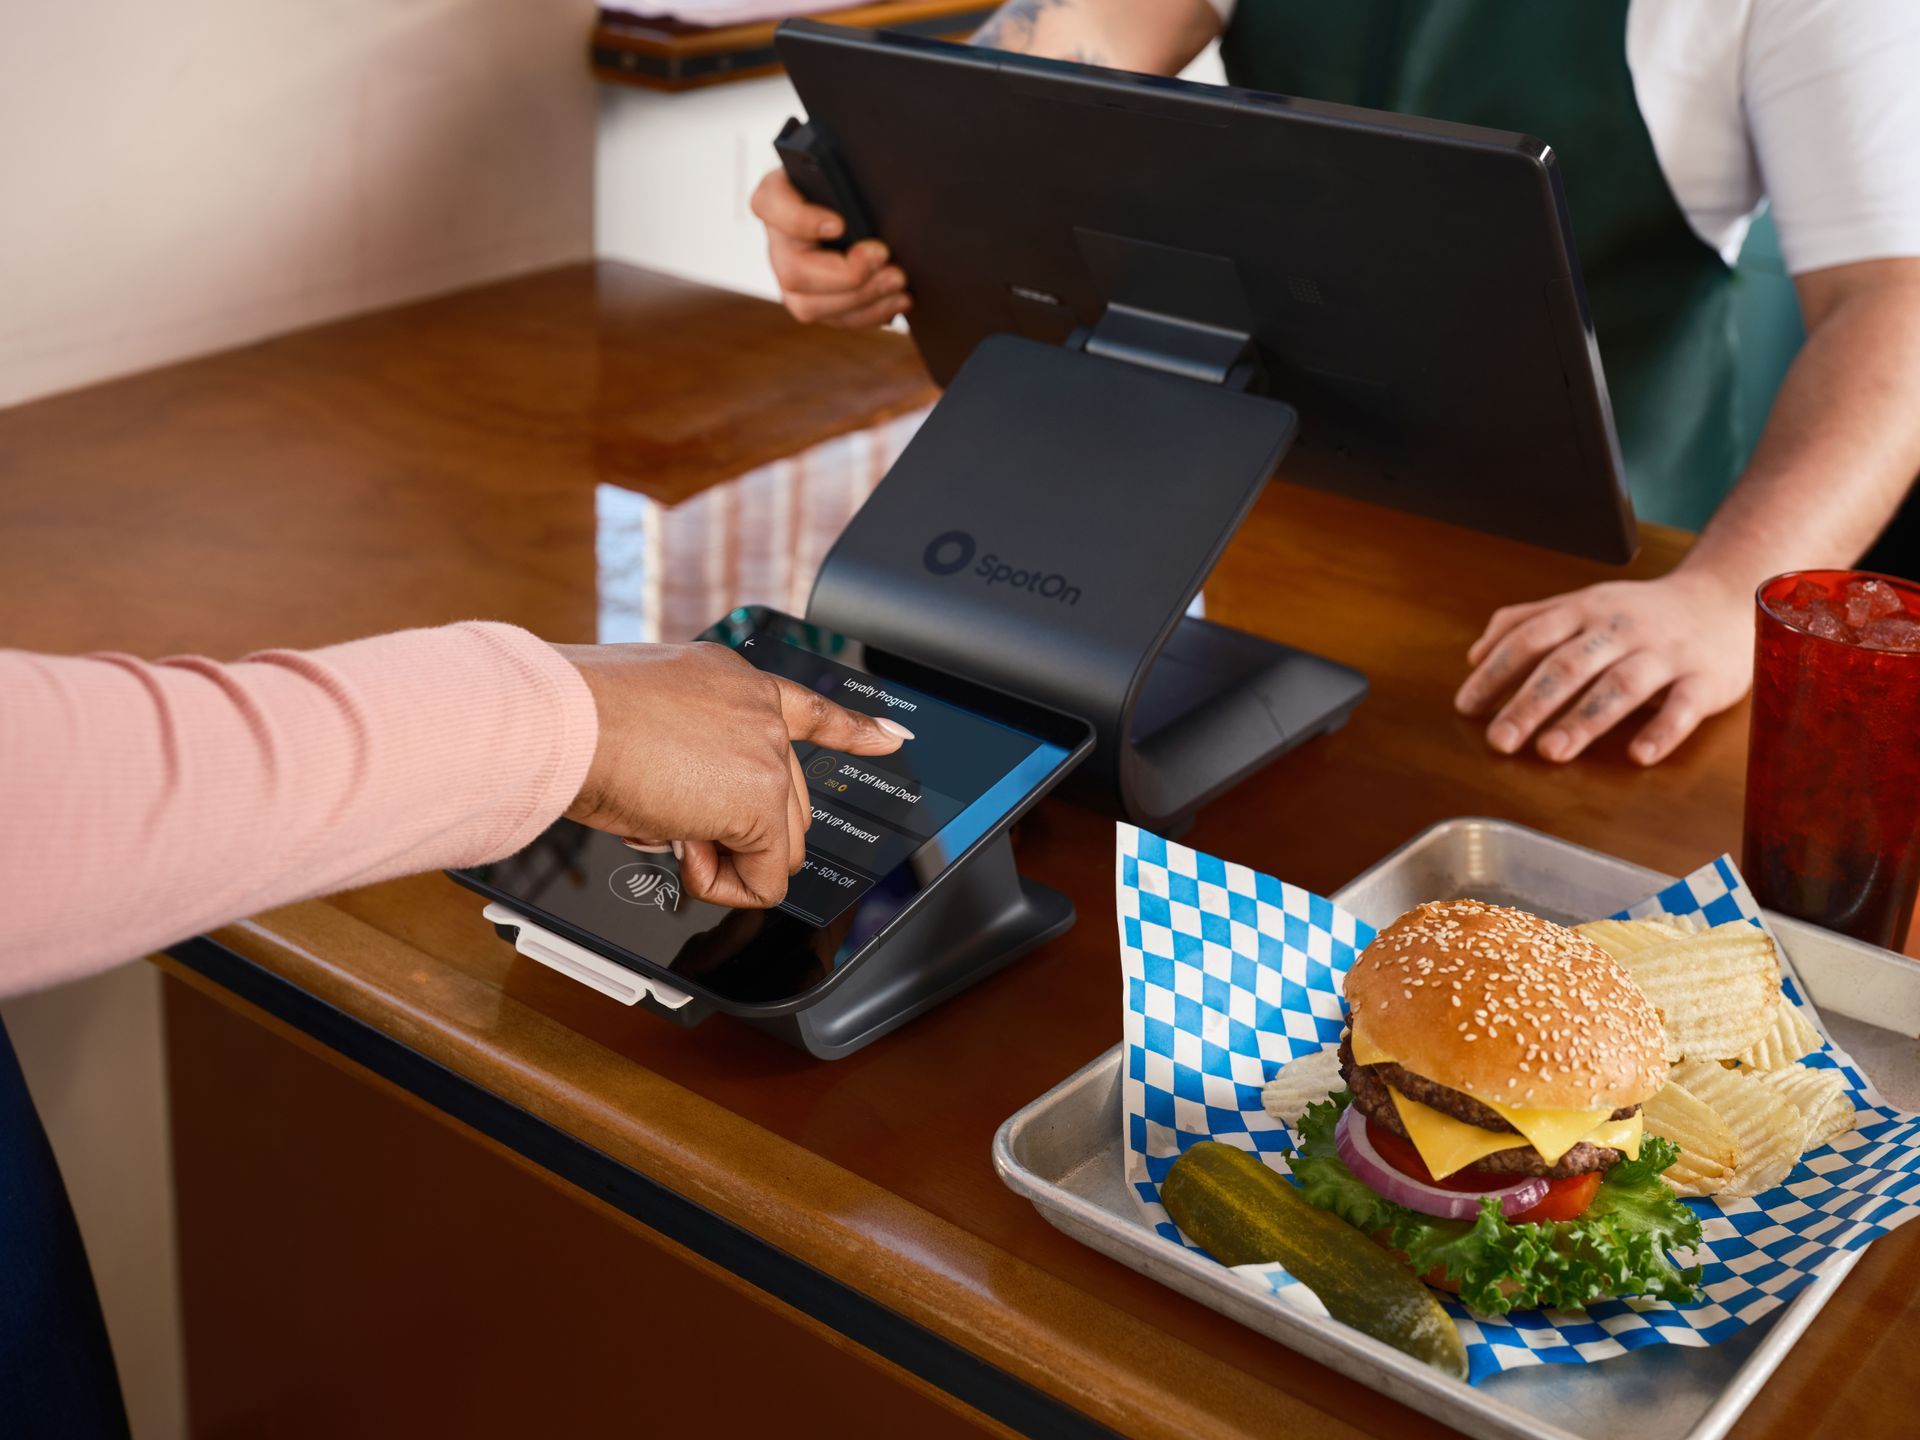
Unify your revenue streams. Consolidate your in-store POS register receipts, online web orders, and third-party delivery marketplace transactions into a single dashboard for real-time sales visibility.
One dataset behind sales, inventory, pricing and marketing
See how the tools share data — and why the answers get sharper when they do.
BLOG
Resources to Help Your Business Thrive
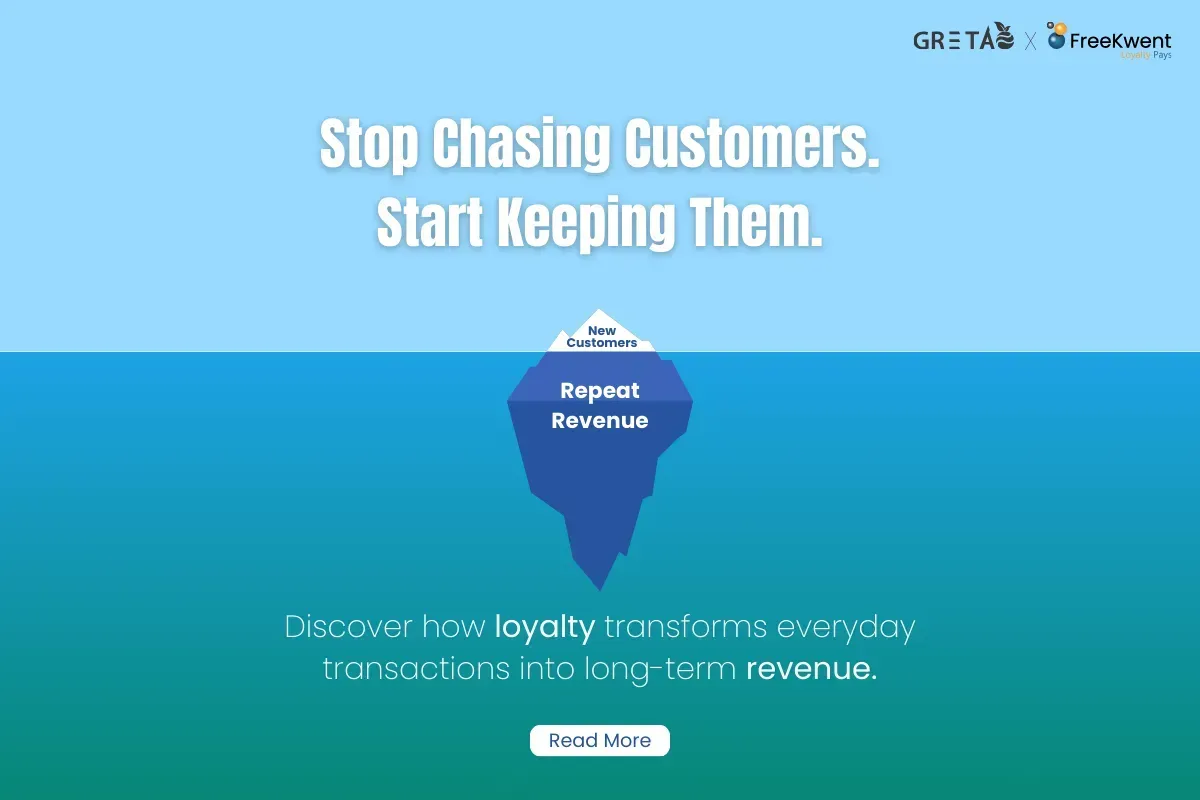
How Do You Get Customer Data To Boost Your Restaurants Sales?
Understanding the customer's journey as they learn about your organization, develop an affection for your products and services

How To Measure ROI From Your Digital Marketing Campaigns?
If you think money is the only thing that matters in your campaign, think again.
Customer Journey As a Marketing Tool
What Is Customer Journey And Why Is It Important To Marketing Professionals?

Social media ROI- How to measure your social media ROI?
What is Social Media ROI? With social media getting used as a great device in enterprises to grow, it's been more and more vital to track the effects
FREQUENTLY ASKED QUESTIONS
Lorem ipsum dolor sit amet consectetur
adipiscing elit.
Question would go here
Describe the item or answer the question so that site visitors who are interested get more information. You can emphasize this text with bullets, italics or bold, and add links.Question would go here
Describe the item or answer the question so that site visitors who are interested get more information. You can emphasize this text with bullets, italics or bold, and add links.Question would go here
Describe the item or answer the question so that site visitors who are interested get more information. You can emphasize this text with bullets, italics or bold, and add links.Question would go here
Describe the item or answer the question so that site visitors who are interested get more information. You can emphasize this text with bullets, italics or bold, and add links.